
Guide to learning to build a financial model.

Financial modeling repeats instructions several times or until a specific result is achievable—an iterative process. It would be best to mark away at different sections until you can finally tie them together.
Below is a step-by-step breakdown of where you should start and how to eventually connect all the dots.
- Historical results and assumptions
You are ready to build a financial model using historical results. You can start with your previous three years’ financial details by inputting them into Excel. Then you reconstruct the assumptions for the historical period by calculating things like revenue growth rate, gross margins, variable cost, and fixed costs. Then consider these to figure out accounts payable days, inventory days, and more. If the AP days are increasing, it shows that the company is making payments slowly, indicating its financial problem. From there, you can fill in the assumptions for the forecast period as complex codes.
2. Start the income statement
When ready, you can calculate the top of the income statement with revenue, cost of goods sold, gross profit, and operating expenses down to earnings before interest, taxes, depreciation, and remuneration. You must wait to calculate depreciation, repayments, interest, and taxes.
3. Start the balance sheet
Once the top of the income statement gets completed, we can start with the Balance sheet by filling in the assumptions, start with the calculations of accounts receivable and inventory, which belong to the group of revenue and cost of goods sold as well as the funds receivable days and inventory days assumptions. Then fill in accounts payable, a function of the cost of goods sold, and arrangements payable days.
4. Build the supporting schedules

Before completing your financial statements, it would help to prepare the programs for capital assets such as property, debts and interest, and plant & equipment. The plan for the plant and equipment can work out from the historical figures deducting the expenses and the depreciation. The same way applies to the debt schedule pulling out from the historical figures and adding the increase in debt, then working out the interest on the balance debt
5. Complete the income statement and balance sheet
The information from the supporting schedules completes the income statement and balance sheet. The income statement links depreciation to the plant & equipment schedule and interest to the debt schedule.
You can calculate earnings before taxes and net income from there. On the balance sheet, link the closing plant & equipment balance and closing debt balance from the schedules.
Shareholder’s equity can be completed by pulling forward last year’s closing balance, adding net income and capital raised, and subtracting dividends or shares repurchased.
6. Build the cash flow statement
Once you have completed the income statement, start building the cash flow statement with the reconciliation method.
Start with net income, add back depreciation, and adjust for changes in non-cash working capital, which results in cash from operations. Cash used in investing is a function of capital expenditures in the plant & equipment schedule, and cash from financing is a function of the assumptions laid out about raising debt and equity.
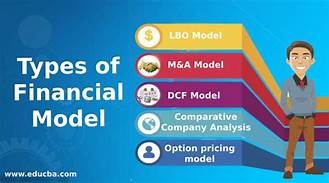
7. Perform the DCF (Discounted Cash flow) analysis
When the 3-statement model gets completed, it’s time to calculate free cash flow and perform the business valuation. The business’s free cash flow is discounted to today at the firm’s cost of capital (its opportunity cost or required rate of return).
8. Build charts and graphs
Clear communication of results separates great from merely good financial analysts. The most effective way to show the results of an economic model is through charts and graphs; most executives don’t have the time or patience to look at the model’s inner workings, so charts are much more effective.